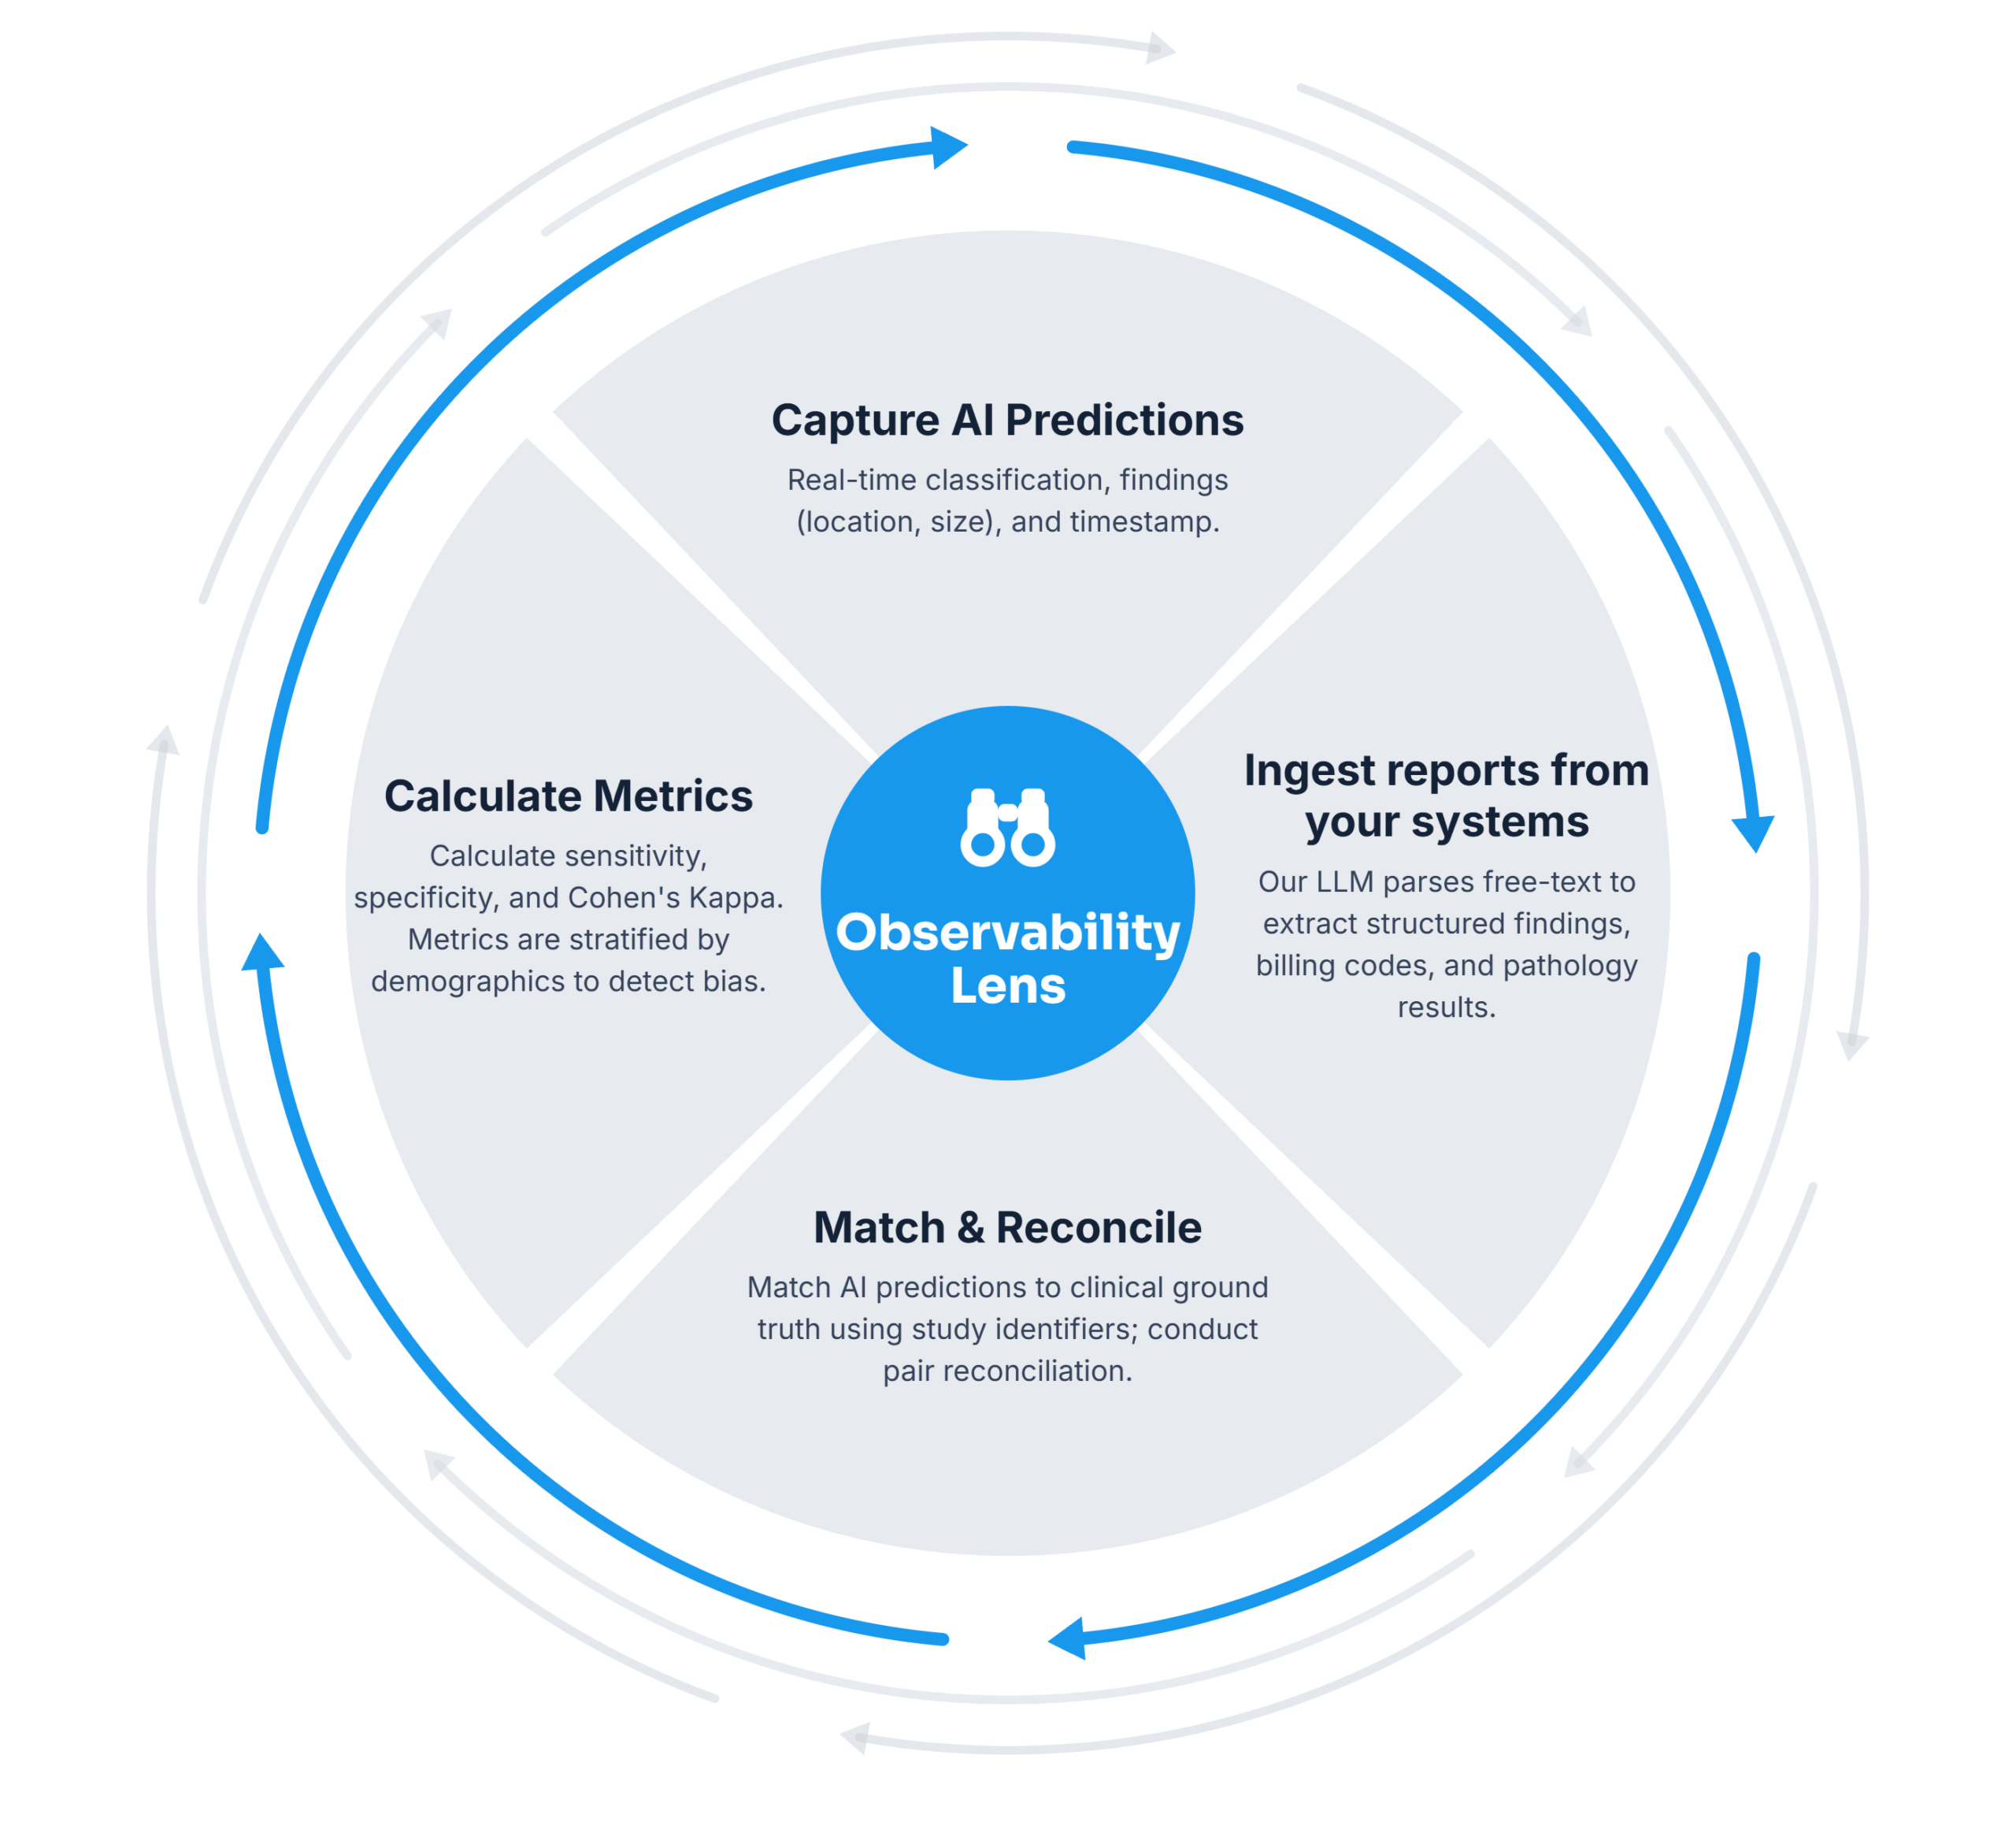
Every prediction is captured, matched to clinical outcomes, and turned into metrics you can act on, without the manual chart review.
From model data to meaningful insights
Observability Lens organizes every signal into three working views, for the people who need to know what AI is doing, whether it’s working, and which model to keep.
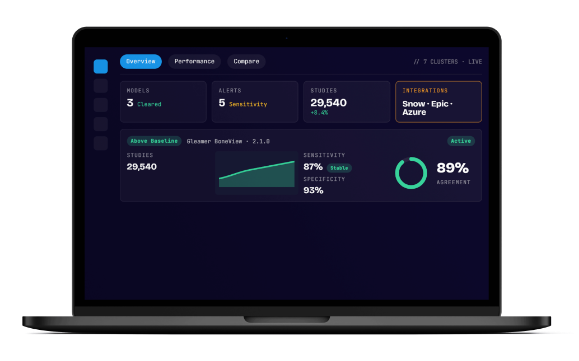
Overview
What AI is running, and is it performing?
Enterprise-wide visibility: Integrations from other vendors appear alongside platform-managed tools, offering a comprehensive view of risk.
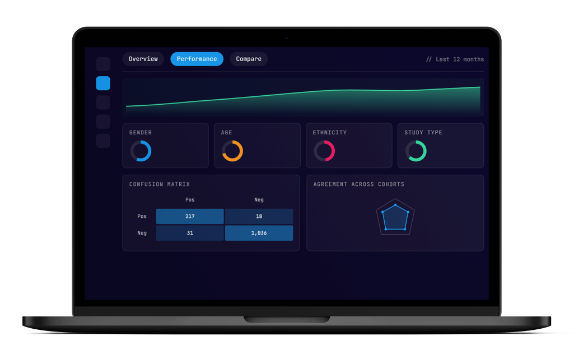
Performance
Is this model maintaining performance or drifting?
Longitudinal tracking reveals whether sensitivity and specificity remain stable. Baseline comparisons highlight drift. Confusion matrices identify areas of failure.
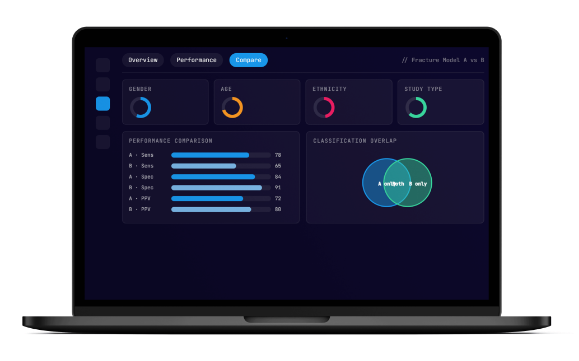
Compare
Which model should we choose or keep?
Head-to-head comparisons reveal which tool identifies more findings, generates fewer false alarms, and performs consistently across your patients. Metrics like sensitivity, specificity, and PPV are displayed side by side.